
Field data for food supply chains
Every ton accounted for, from field to factory.
Aconcagua turns everyday farm work into verified production, traceability and carbon data. Growers record it in a chat. Buyers see it in one dashboard, ready for audits, certification and sustainability reports.
- IPCC Tier 1 emission factors
- GHG Protocol aligned
- Lot-level traceability
- Runs on any phone
Why now
Sustainability reporting has moved from the brand to the field.
Buyers are being asked to prove where their raw materials come from and what it took to grow them. That evidence starts on the farm, and today most of it never gets written down.
The evidence lives in notebooks
Spray records, irrigation, diesel and fertilizer are scattered across paper, spreadsheets and group chats, if they are recorded at all.
Farm software wasn't built for the tractor seat
Most tools assume an agronomist at a desk. The people doing the work need something they can use in a minute, mid-shift.
Audits and 2030 targets need proof
Scope 3 reporting and buyer audits require field-level numbers that can be traced back to a lot, a date and a practice.
How it works
Simple for the grower. Complete for the buyer.
No app to install. No training.
The Aconcagua bot asks one question at a time, so records come in complete and consistent, straight from the field.
01
Capture
Growers log each activity in a guided Telegram chat: planting, sprays, irrigation, fertilizer, harvest and every truck that leaves the field.
02
Calculate
Each record is validated and converted into indicators: emissions by activity, water per ton, agrochemical impact and yield.
03
Report
The Control Center brings every grower and lot together, comparable across regions and seasons, with exports ready for audits.
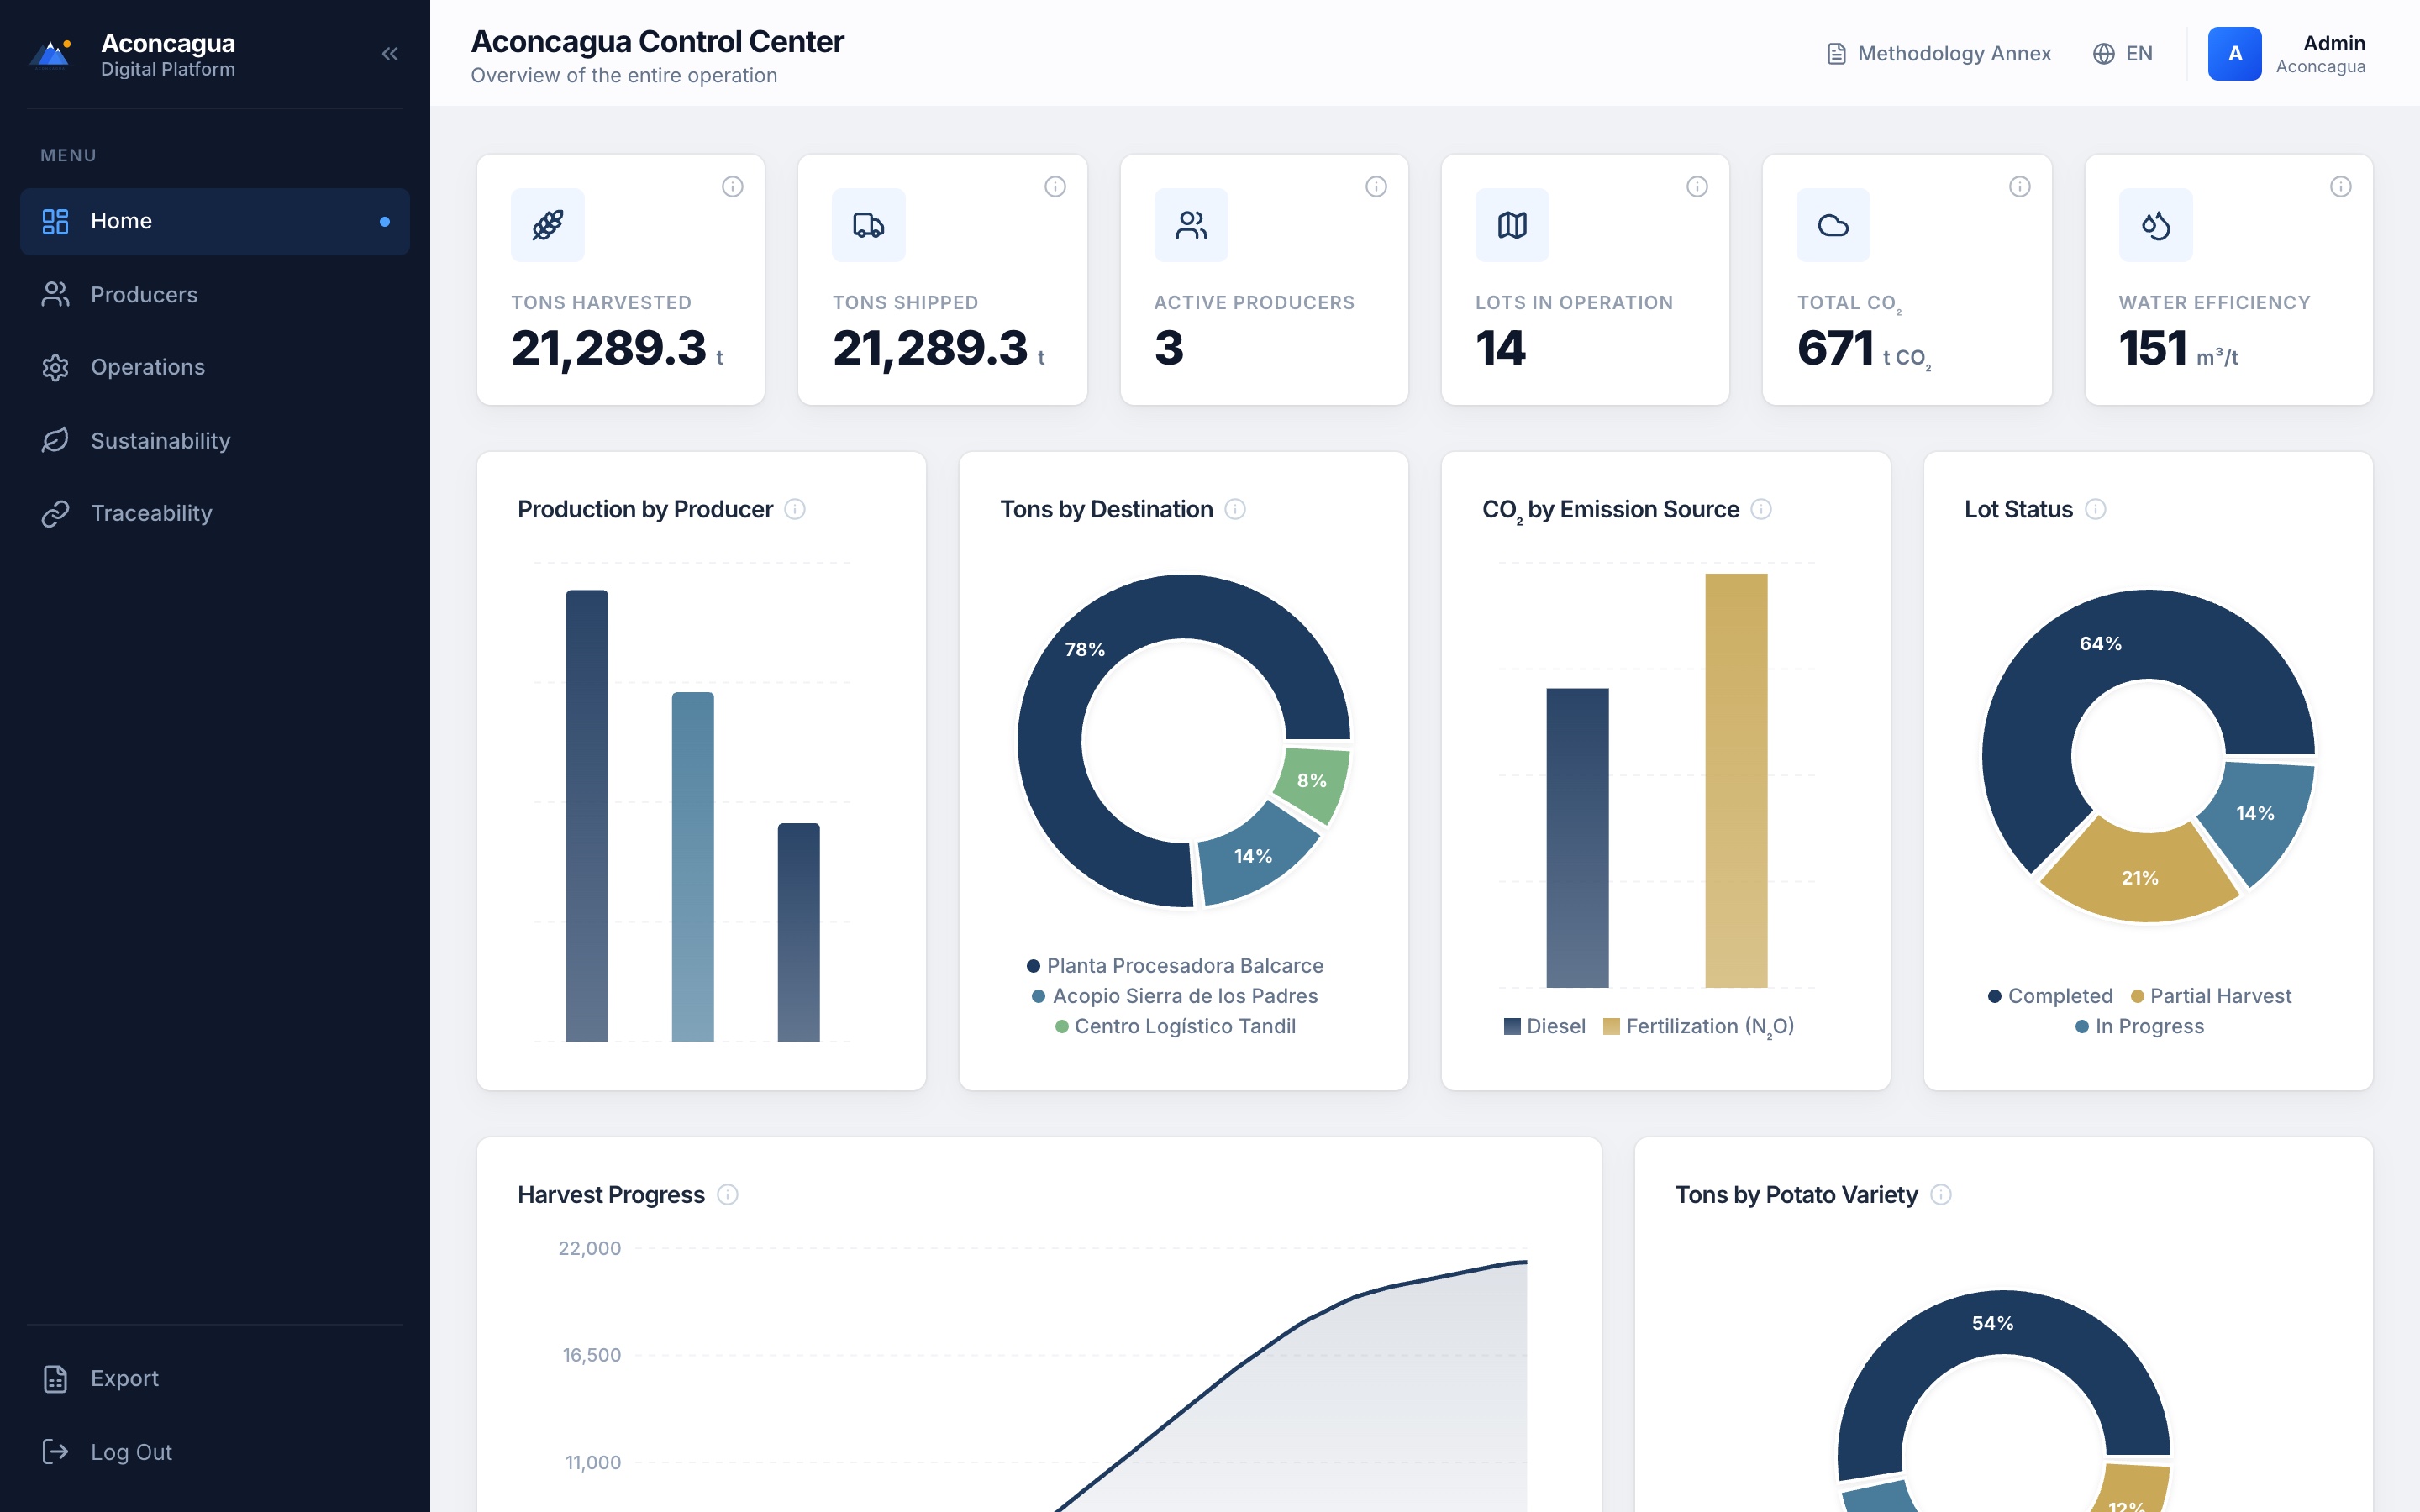
The Control Center
One dashboard for your whole supply base.
Harvest, shipments, active lots and footprint across every grower, updated as trucks leave the field.
Screens shown with demo data.
New: GlobalG.A.P. module
GlobalG.A.P. compliance, made simple.
From daily farm activities to certification-ready records.
Growers log machinery, crew, inputs and applications in the same Telegram chat they already use. Aconcagua organizes it into structured, exportable records that support certification and audit preparation, with nothing entered twice.
One simple input. Multiple valuable outputs.
Recorded once, in Telegram
Activities, inputs, machinery and crew
- Farm management
- Lot traceability
- Sustainability indicators
- GlobalG.A.P. records
Machinery & crew
- Register machinery and equipment
- Register operators and employees
- Link every job to its lot, machine and person in charge
Inputs & stock
- Register crop protection products and fertilizers
- Keep track of available stock
- Inputs are deducted automatically when an application is logged
Digital application orders
- Create spray and fertilizer orders straight from Telegram
- Lot, products, operator, machinery and task in one order
- Share it with the operator on WhatsApp, with a digital record kept
GlobalG.A.P. records
- Data organized by the fields GlobalG.A.P. documentation asks for
- Exportable sheets and records in the formats used for certification
- No double entry, and faster audit preparation
What you can answer
The questions your team gets asked, answered with data.
Where did this load come from?
Trace any truck back to its lot, field and grower, with the full activity history behind it.
What is our footprint per ton?
See emissions per ton and per hectare for each grower, crop and variety.
Which practices drive our emissions?
Break the footprint down by diesel, irrigation and nitrogen to know where to act first.
Are we on track this season?
Follow harvest progress, lot status and contract volumes as they happen.
Methodology
Numbers you can defend.
Calculations follow published, auditable methods, and every figure links back to the records that produced it.
IPCC Tier 1
Emission factors for diesel use and nitrous oxide from nitrogen fertilizer, with IPCC AR6 warming potentials.
GHG Protocol aligned
On-farm emissions structured for your Scope 3 inventory.
Methodology annex
Every factor and formula documented and included with your reports.
Where the footprint usually is
In crop production, a few activities explain most emissions. Measuring each one shows where improvement pays off.
In the field
Built alongside the growers who use it.
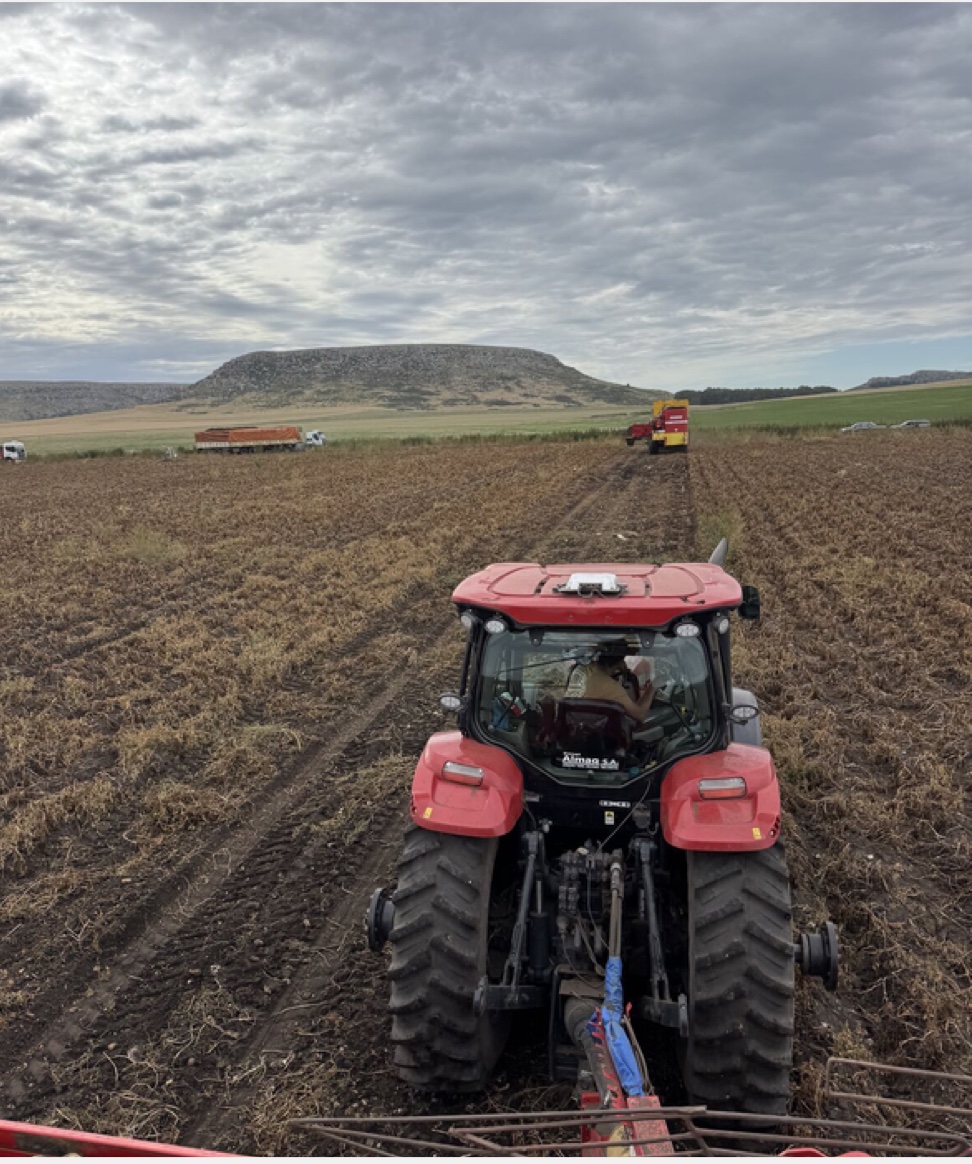
Aconcagua was shaped on working potato farms, around the way field work actually gets done.
Every flow in Aconcagua was designed and tested in the field, side by side with the growers and crews who use it every day.
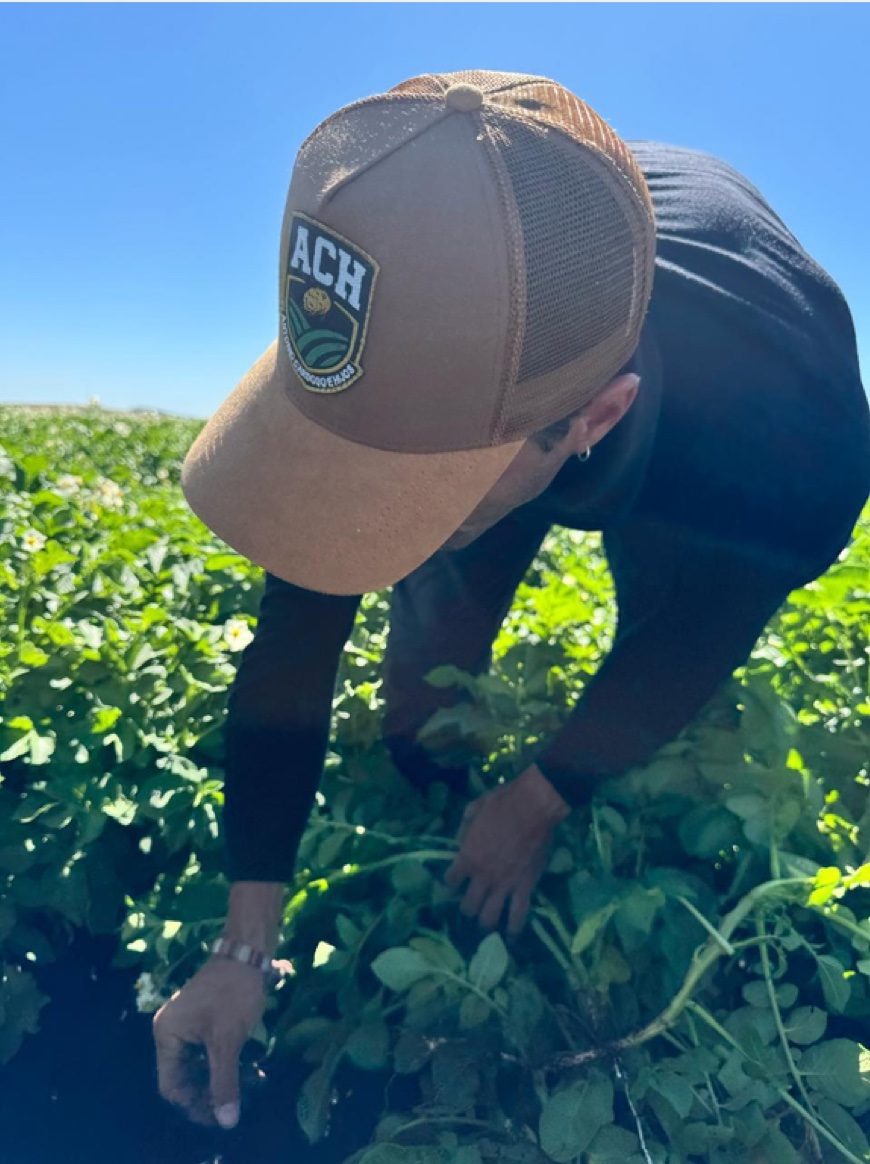
Antonio Cardoso e Hijos
Potato growers · Development partner
About us
Agronomy and software, from the same team.
Aconcagua Digital started on a potato farm. Co-founder Santiago Cardoso is a third-generation grower at Antonio Cardoso e Hijos, near Mar del Plata, Argentina. He saw first-hand how much field work never makes it onto paper, just as buyers began asking to see all of it.
So we built the tool we wanted on our own farm: a chat that records the work in a minute, and a platform that turns it into traceability, carbon and certification data. Our mission is to make every ton of food traceable to the field it came from, without adding work for the people who grow it.
Press
Aconcagua in the news
Potato Gazette · Oct 12, 2026
Aconcagua Digital Platform for Potato Traceability
ARGENPAPA · Oct 5, 2026· In Spanish
Argentina: Aconcagua propone simplificar el registro de labores y la trazabilidad en la producción de papa
Potato Grower · Sep 24, 2026
PapaDX brings AI-powered potato diagnostics and field intelligence to growers
Potato News Today · Sep 23, 2026
PapaDX moves beyond photo diagnosis as AI assistant learns the history of individual potato fields
Potato Gazette · Sep 21, 2026
Argentine grower launches AI potato diagnosis app
Potatoes News · Sep 4, 2026
From a smartphone snapshot to a diagnosis: Argentina's PapaDX rewrites the rules of potato health with AI
PotatoPro · Sep 1, 2026
Argentina: PapaDX applies artificial intelligence to diagnose problems in potato crops
Writing about agriculture or supply chains?
We're happy to share data, logos, or set up an interview.
Press contactSee your supply base the way your auditors will.
Tell us about your crops and growers, and we'll walk you through the Control Center.